Date last run: 25Oct2019
Introduction
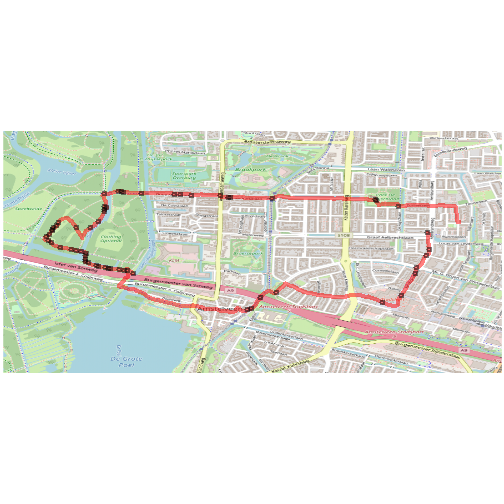
With the Maverick app it is possible to ‘record’ your walk. This document shows how such a record can be used to represent the walk on a map.
Processing
Transfer from smart phone to desktop
I do not use the ‘pro’ but the free version (version v2.8) and have not found a way to retrieve the recorded gpx file other than via file transfer to my desktop computer.
Removed: a complaint about my struggles with the dedicated transfer program of my HUAWEI P20 lite phone.
File contents
On my desktop I saw that the layout of the file was as follows:
#>     [1] "<?xml version=\"1.0\" encoding=\"UTF-8\" ?>"
#>     [2] "<gpx"
#>     [3] " version=\"1.0\""
#>     [4] " creator=\"Maverick - http://www.maverickgps.com\""
#>     [5] " xmlns:xsi=\"http://www.w3.org/2001/XMLSchema-instance\""
#>     [6] " xmlns=\"http://www.topografix.com/GPX/1/0\""
#>     [7] " xsi:schemaLocation=\"http://www.topografix.com/GPX/1/0 http://
#> www.topografix.com/GPX/1/0/gpx.xsd\">"
#>     [8] "<time>2019-10-22T13:07:49Z</time>"
#>     [9] "<trk>"
#>    [10] " <name>2019-10-22 @ 15-07-49</name>"
#>    [11] " <trkseg>"
#>    [12] "  <trkpt lat=\"52.308491\" lon=\"4.862949\">"
#>    [13] "    <ele>52</ele>"
#>    [14] "    <time>2019-10-22T13:07:51Z</time>"
#>    [15] "    <speed>0.0</speed>"
#>    [16] "  </trkpt>"
#> 	 ....
#>  [5462] "  <trkpt lat=\"52.309296\" lon=\"4.865317\">"
#>  [5463] "    <ele>38</ele>"
#>  [5464] "    <time>2019-10-22T14:55:12Z</time>"
#>  [5465] "    <speed>0.78828895</speed>"
#>  [5466] "  </trkpt>"
#>  [5467] " </trkseg>"
#>  [5468] "</trk>"
#>  [5469] "</gpx>"
Handle the file in R
I had prepared to refresh my memory about techniques to handle xml data, but decided to search the internet for the combination of rstats and gpx first. One of the first entries was Stay on track: Plotting GPS tracks with R. This told me how to do it and more. So I left out what I did not need and changed the following:
- the bounding box is a little expanded to avoid that the walk touches the boundaries of the map
- I did not calculate the speed but extracted it from the
xmlfile - I also display the points where the speed is equal to zero
Problem with install of rJava
Creating the data.frame that serves as input for the plot with the given code was no problem. I encountered a problem with the statement library(OpenStreetMap) (NB I use HOQCutil::silent_library ). The problem was caused by a reinstall of the Java code. I could solve it by following the very useful Installing rJava on Windows 10 workflow by Jorge Cimentada.
Adapted code from Stay on track: Plotting GPS tracks with R
gpx_file = 'mywalk.gpx'
HOQCutil::silent_library(XML)           # or library(XML)
HOQCutil::silent_library(OpenStreetMap) # or library(OpenStreetMap)
HOQCutil::silent_library(lubridate)     # or library(lubridate)
HOQCutil::silent_library(dplyr)         # or library(dplyr)

# Parse the GPX file
pfile <- htmlTreeParse(gpx_file,
                      error = function (...) {}, useInternalNodes = T)
# Get all elevations, times and coordinates via the respective xpath
elevations <- as.numeric(xpathSApply(pfile, path = "//trkpt/ele", xmlValue))
times <- xpathSApply(pfile, path = "//trkpt/time", xmlValue)
coords <- xpathSApply(pfile, path = "//trkpt", xmlAttrs)
speed <- as.numeric(xpathSApply(pfile, path = "//trkpt/speed", xmlValue))
# Extract latitude and longitude from the coordinates
lats <- as.numeric(coords["lat",])
lons <- as.numeric(coords["lon",])
# Put everything in a dataframe and get rid of old variables
geodf <- data.frame(lat = lats, lon = lons, ele = elevations, time = times,speed=speed)
rm(list=c("elevations", "lats", "lons", "pfile", "times", "coords", "speed"))
head(geodf)
#>        lat      lon ele                 time     speed
#> 1 52.30849 4.862949  52 2019-10-22T13:07:51Z 0.0000000
#> 2 52.30843 4.862967  51 2019-10-22T13:08:09Z 0.3867474
#> 3 52.30838 4.862996  49 2019-10-22T13:08:12Z 1.4232483
#> 4 52.30834 4.863027  49 2019-10-22T13:08:14Z 1.3450623
#> 5 52.30829 4.863062  49 2019-10-22T13:08:16Z 1.5338972
#> 6 52.30825 4.863073  49 2019-10-22T13:08:19Z 1.0635910
stopped = dplyr::filter(geodf,speed==0)

dif_lat = 0.5*(max(geodf$lat) - min(geodf$lat))
dif_lon = 0.1*(max(geodf$lon) - min(geodf$lon))
map <- openmap(as.numeric(c(max(geodf$lat)+dif_lat, min(geodf$lon)-dif_lon)),
               as.numeric(c(min(geodf$lat)-dif_lat, max(geodf$lon)+dif_lon)), type = "osm")

transmap <- openproj(map, projection = "+proj=longlat")

#png("map1.png", width = 1000, height = 800, res = 100)
par(mar = rep(0,4))
plot(transmap, raster=T)
lines(geodf$lon, geodf$lat, type = "l", col = scales::alpha("red", .5), lwd = 4)
points(stopped$lon, stopped$lat,col = scales::alpha("black", .5), lwd = 2)
#dev.off()
Appendix
function silent_library
The function silent_library is contained in the package HOQCutil that can be installed with
# install.packages("devtools")
devtools::install_github("HanOostdijk/HOQCutil")
Session Info
This document was produced on 25Oct2019 with the following R environment:
  #> R version 3.6.0 (2019-04-26)
  #> Platform: x86_64-w64-mingw32/x64 (64-bit)
  #> Running under: Windows 10 x64 (build 18362)
  #>
  #> Matrix products: default
  #>
  #> locale:
  #> [1] LC_COLLATE=English_United States.1252
  #> [2] LC_CTYPE=English_United States.1252
  #> [3] LC_MONETARY=English_United States.1252
  #> [4] LC_NUMERIC=C
  #> [5] LC_TIME=English_United States.1252
  #>
  #> attached base packages:
  #> [1] stats     graphics  grDevices utils     datasets  methods   base
  #>
  #> other attached packages:
  #> [1] dplyr_0.8.3         lubridate_1.7.4     OpenStreetMap_0.3.4
  #> [4] XML_3.98-1.20
  #>
  #> loaded via a namespace (and not attached):
  #>  [1] Rcpp_1.0.2       highr_0.8        compiler_3.6.0   pillar_1.4.2
  #>  [5] tools_3.6.0      digest_0.6.22    evaluate_0.14    tibble_2.1.3
  #>  [9] gtable_0.3.0     lattice_0.20-38  pkgconfig_2.0.2  rlang_0.4.0
  #> [13] rgdal_1.4-4      xfun_0.8         rJava_0.9-11     stringr_1.4.0
  #> [17] raster_2.9-23    knitr_1.25       grid_3.6.0       tidyselect_0.2.5
  #> [21] glue_1.3.1       R6_2.4.0         rmarkdown_1.16   sp_1.3-1
  #> [25] ggplot2_3.2.1    purrr_0.3.2      magrittr_1.5     scales_1.0.0
  #> [29] codetools_0.2-16 htmltools_0.3.6  assertthat_0.2.1 colorspace_1.4-1
  #> [33] stringi_1.4.3    lazyeval_0.2.1   HOQCutil_0.1.14  munsell_0.5.0
  #> [37] crayon_1.3.4