In this document we show how to create an image consisting of image and a subsection of that image. We use the R package magick. For details about these packages see the reference manual and vignette.
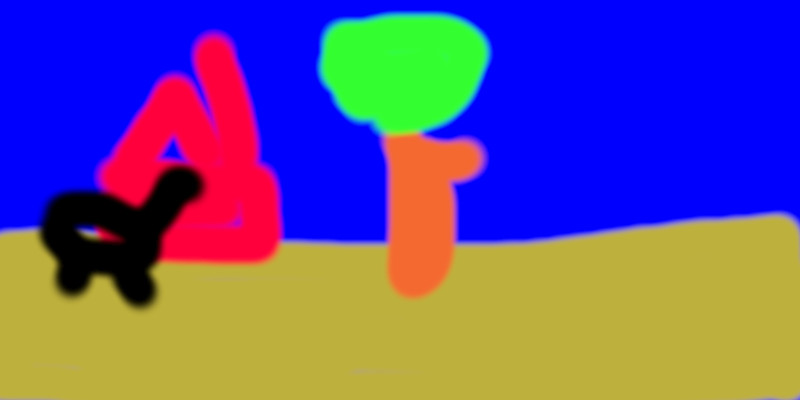
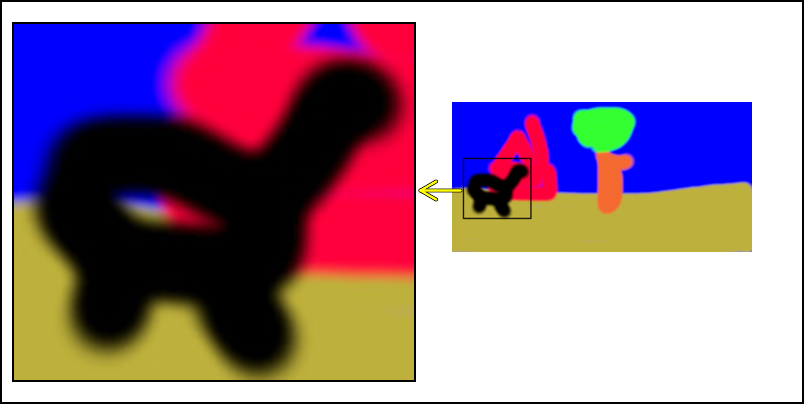
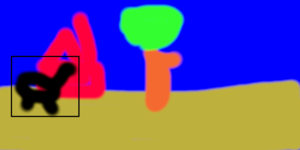
In Figure 1 we show the original input. We extract the animal shaped figure and position an enlarged version beside the original version in Figure 2. With an arrow and a selection box we visibly indicate what was done.
Utility functions
Because I want to use the pipe of the magrittr package but keep the code as clean as possible, I made a local copy of %>% .
I also defined the cond_set function that creates a list from a given one by checking a list of names with corresponding default values. As an exemple:
  myoptions = list(dx=10,dy=5,sep=',')
  myparms = c('dx','dy', 'x','y')
  mydefs  = c(info$width,info$height,0,0)
  myoptions2 = cond_set(myparms, mydefs,myoptions)
Here the list list(dx=10,dy=5,x=0,y=0) is generated by using the default 0 for x and y and removing sep because that is not given in myparms.
Also the utility functions add_rect and add_arrows were defined as cover functions for the base R functions rect and arrows. These functions add a rectangle resp. arrows to a Magick image.
`%>%` = magrittr::`%>%`

cond_set <- function(myparms, mydefs, myoptions) {
	cond_set1 <- function(var,def,mystruct) {
		if (!is.null(mystruct[[var]])) {
			res = mystruct[[var]]
		} else {
			res = def
		}
		res
	}
	myoptions2 = purrr::map2(myparms, mydefs, ~ cond_set1(.x,.y, myoptions))
	names(myoptions2) = myparms
	myoptions2
}

add_rect <- function(im_object,
	xleft, ybottom, xright, ytop, density = NULL, angle = 45,
	col = NA, border = NULL, lty = par("lty"), lwd = par("lwd"),
	...)
{
	img <- magick::image_draw(im_object)
	rect(xleft, ybottom, xright, ytop, density, angle,
		col, border, lty , lwd,
		...	)
	d <- dev.off()
	img
}

add_arrows <- function(im_object,
	x0, y0, x1 = x0, y1 = y0, length = 0.25, angle = 30,
	code = 2, col = par("fg"), lty = par("lty"),
	lwd = par("lwd"), ...)
{
	img <- magick::image_draw(im_object)
	arrows(x0, y0, x1 , y1, length, angle ,
		code = 2, col, lty, lwd, ...)
	d <- dev.off()
	img
}
Main functions
Most functions defined here have a parameter list that is described by myparms and mydefs in the function. The offsets in comb_it have the format ‘+x+y’. The geometry in resize_it has the format ‘nnnx’, ‘xnnn’ or ‘mmmxnnn’ and in the border specification the format mxn with m and n integers.
The following functions are defined:
crop_it: create a new image by extracting a rectangle ofdxbydyat an offset of (x,y) of an existing imageshow_it: create a new image by drawing a rectangle ofdxbydyat an offset of (x,y) of an existing imagecomb_it: create a new image with given dimensions and color and place on it two existing images with given offsets. For the new image two border specifications can be given: e.g. a wide gray one and a narrow black one by specifying colors and geometriesresize_it: create a new image by resizing an existing oneborder_it: create a new image by adding a border to an existing one
NB. as usual in image calculations the y-coordinate starts with 0 at the top of the image and increases when going to the bottom. In contrast, in mathematical plots the y-coordinate decreases when going to the bottom of the plot.
crop_it <- function (img,myoptions) {
  force(myoptions)
  info= magick::image_info(img)
  myparms = c('dx','dy', 'x','y')
  mydefs  = c(info$width,info$height,0,0)
  myoptions2 = cond_set(myparms, mydefs,myoptions)
  img %>%
    magick::image_crop(glue::glue_data(myoptions2,"{dx}x{dy}+{x}+{y}"))
}

show_it <- function (img,myoptions) {
	force(myoptions)
	info= magick::image_info(img)
	myparms = c('dx','dy', 'x','y',
	   'border', 'lty', 'lwd')
	mydefs  = list(info$width,info$height,0,0,NULL,par("lty"),par("lwd"))
	myoptions2 = cond_set(myparms, mydefs,myoptions)
	xleft   = myoptions2$x
	xright  = xleft + myoptions2$dx
	ytop    = myoptions2$y
	ybottom = ytop + myoptions2$dy
	xoords = c(	xleft, ybottom, xright, ytop)
	add_rect(img,
		xleft, ybottom, xright, ytop,border=myoptions2$border,
		lty = myoptions2$lty, lwd = myoptions2$lwd)
}

comb_it <- function(newspec, img1, offset1, img2, offset2) {
  # offsets given as '+x+y'
	force(newspec)
	myparms = c('width', 'height', 'color',
		'bordercol1',	'bordergem1',	'bordercol2',	'bordergem2')
	mydefs  = list(800, 400, 'white', 'lightgray', NA, 'lightgray', NA)
	newspec = cond_set(myparms, mydefs, newspec)
	imgcomb <-
		magick::image_blank(newspec$width, newspec$height, color = newspec$color)
	imgcomb = magick::image_composite(imgcomb, img1, offset = offset1)
	imgcomb = magick::image_composite(imgcomb, img2, offset = offset2)
	if (!is.na(newspec$bordergem1)) {
		imgcomb = border_it(imgcomb,
			color=newspec$bordercol1, geometry = newspec$bordergem1)
	}
	if (!is.na(newspec$bordergem2)) {
		imgcomb = border_it(imgcomb,
			color=newspec$bordercol2, geometry = newspec$bordergem2)
	}
	imgcomb
}

resize_it <- function(img,g) {
	magick::image_resize(img, geometry = g, filter = NULL)
}

border_it <- function(img, color='yellow', geometry = '1x1') {
	magick::image_border(img,	color = color, geometry = geometry)
}
Using the functions
Read the input file
Define the datasets for input and output
image_fn1 = "myart1.jpg"
image_fn2 = "myart2.jpg"
img1 = magick::image_read(image_fn1)
magick::image_info(img1)
#> # A tibble: 1 x 7
#>   format width height colorspace matte filesize density
#>   <chr>  <int>  <int> <chr>      <lgl>    <int> <chr>
#> 1 JPEG     800    400 sRGB       FALSE    22244 72x72
The 'print(img1)' statement would produce Figure 1.
Extract part of the image
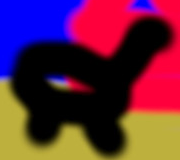
With the list spad we define which part of the image we want to extract and how (later) we will draw a rectangle on this image.
spad = list(dx=180,dy=160,x=30,y=150,border='black',lwd=4)
img2 = crop_it(img1,spad)
magick::image_info(img2)
#> # A tibble: 1 x 7
#>   format width height colorspace matte filesize density
#>   <chr>  <int>  <int> <chr>      <lgl>    <int> <chr>
#> 1 JPEG     180    160 sRGB       FALSE        0 72x72
img2
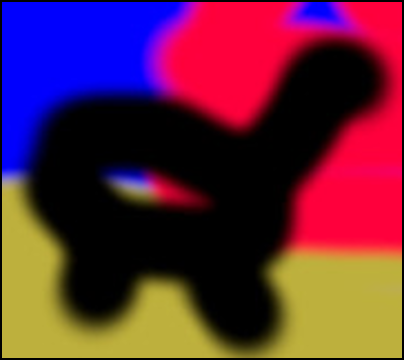
We resize the image to a width of about 400 pixels (keeping the aspect ratio intact) and give it a black border of 2 pixels on all sides:
img2 = resize_it(img2, '400x')
img2 = border_it(img2, color='black', geometry = '2x2')
magick::image_info(img2)
#> # A tibble: 1 x 7
#>   format width height colorspace matte filesize density
#>   <chr>  <int>  <int> <chr>      <lgl>    <int> <chr>
#> 1 JPEG     404    360 sRGB       FALSE        0 72x72
img2
Indicate which part is extracted on the original image
We use the same spad list to show which part of the original image we did extract. After doing that we resize it so that we can combine it with Figure 4
img12 = show_it(img1,spad)
img12 = resize_it(img12,'300x')
img12
Combine Figure 4 and Figure 5
Now we combine the two images and add one arrow from the original image to the enlarged section. For the arrow we use two calls with different colors and line widths. The result is a yellow arrow with a black boundary.
imgcomb= comb_it(list(bordergem2='2x2',bordercol2='black'),img12,"+450+100",img2,"+10+020" )
imgcomb = add_arrows(imgcomb,
	460, 190, 420, 190,col='black',lwd=5)
imgcomb = add_arrows(imgcomb,
	460, 190, 420, 190,col='yellow',lwd=3)
imgcomb

Write the image to an external file
Write the image to an external file. It will refuse to do so (without a warning) when the file already exists. Therefore first (try to) remove it.
invisible(base::file.remove(image_fn2))
magick::image_write(imgcomb,image_fn2)
Session Info
#> R version 3.6.0 (2019-04-26)
#> Platform: x86_64-w64-mingw32/x64 (64-bit)
#> Running under: Windows 10 x64 (build 18362)
#>
#> Matrix products: default
#>
#> locale:
#> [1] LC_COLLATE=English_United States.1252
#> [2] LC_CTYPE=English_United States.1252
#> [3] LC_MONETARY=English_United States.1252
#> [4] LC_NUMERIC=C
#> [5] LC_TIME=English_United States.1252
#>
#> attached base packages:
#> [1] stats     graphics  grDevices utils     datasets  methods   base
#>
#> other attached packages:
#>  [1] HOQCutil_0.1.10 jsonlite_1.6    glue_1.3.1      purrr_0.3.2
#>  [5] xml2_1.2.2      ggspatial_1.0.3 ggplot2_3.2.1   sf_0.7-7
#>  [9] dplyr_0.8.3     stringr_1.4.0   osmdata_0.1.1
#>
#> loaded via a namespace (and not attached):
#>  [1] tidyselect_0.2.5   xfun_0.8           lattice_0.20-38
#>  [4] vctrs_0.2.0        colorspace_1.4-1   htmltools_0.3.6
#>  [7] utf8_1.1.4         rlang_0.4.0        e1071_1.7-0
#> [10] pillar_1.4.2       withr_2.1.2        DBI_1.0.0
#> [13] sp_1.3-1           readxl_1.3.1       lifecycle_0.1.0
#> [16] plyr_1.8.4         cellranger_1.1.0   munsell_0.5.0
#> [19] blogdown_0.15      gtable_0.3.0       rvest_0.3.4
#> [22] evaluate_0.14      knitr_1.24         prettymapr_0.2.2
#> [25] curl_4.0           class_7.3-15       fansi_0.4.0
#> [28] highr_0.8          Rcpp_1.0.2         KernSmooth_2.23-15
#> [31] backports_1.1.4    scales_1.0.0       classInt_0.3-3
#> [34] magick_2.2         captioner_2.2.3    fs_1.3.1
#> [37] png_0.1-7          digest_0.6.20      stringi_1.4.3
#> [40] rosm_0.2.5         grid_3.6.0         cli_1.1.0
#> [43] rgdal_1.4-4        tools_3.6.0        magrittr_1.5
#> [46] lazyeval_0.2.1     tibble_2.1.3       zeallot_0.1.0
#> [49] tidyr_1.0.0        crayon_1.3.4       pkgconfig_2.0.2
#> [52] lubridate_1.7.4    assertthat_0.2.1   rmarkdown_1.15
#> [55] httr_1.4.1         R6_2.4.0           units_0.6-2
#> [58] compiler_3.6.0